Figure 1: Resource Load
Availability (Example 1)
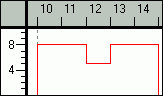
Figure 2: Resource Load Availability (Example 2)
When it comes to resource planning and allocation, it is important to be able to view the work load of the resources, based on preplanned information from IFS/Enterprise Asset Management, IFS/Service Management, and/or IFS Human Resources. The Resource Load Graph window in IFS/Enterprise Asset Management and IFS/Service Management fulfills this requirement. A resource is an employee or tool-and-facility. The load details are retrieved from work orders, separate PM actions, and their related operations and tools-and-facilities. In addition, load details are also retrieved from IFS Human Resources if installed.
The load details will only be displayed if one or more of the following conditions are fulfilled:
In addition:
In order to view the details in the window, you need to first define a search criteria. You can search based on the site, maintenance organization, time interval, and resource type. Next, based on the resource type you selected, you can further narrow down the search based on craft, craft group, employee OR tool and facility type and tool and facility ID.
The Resource Load Graph window is divided into several sections:
Filter area: Once the details related to your search has been displayed you can further filter the details. You have the option of filtering the details based on the maintenance organization, resource type (i.e., employee or tools and facilities), craft and/or tool and facility type.
Frame Settings: Allows you to control the resolution of the graph, i.e., the scale (whether information should be displayed on a daily or weekly basis) and the time range the graph should accommodate. Note: Ideally the values you define for the frame settings should be within the date/time parameters defined in the search. If you select a range outside the search dates, you will have to perform the search again.
Graph area: Displays the availability and the work load information in a graphical format. Contains the following information for each resource.
The availability of the resource is displayed by a red line (see below).
|
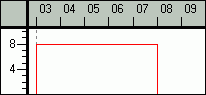
Figure 1: Resource Load
|
Figure 2: Resource Load Availability (Example 2) |
The availability is retrieved from the employee schedules of IFS Human Resources (if installed) and/or the work time calendar of the maintenance organization to which the resource is connected. Figure 1 above displays the typical availability for a particular resource, i.e., the resource is available eight hours a day, five days a week. Figure 2 displays an instance where the particular resource is not available for three hours during the week (e.g. employee is on leave, training, etc). Note: It is important to note that the red line signifies the number of hours the resource is available for a particular day and NOT the times.
Load Details: Displays the work order number, PM action ID and the dates for which the resource is booked along with the planned number of hours.
The load details for a resource is presented against the availability with different colored bars as follows:
| Type of information | Color |
| Corrective Work Order |
|
| Preventive Work Order |
|
| Route Work Order |
|
| Planned PM Action |
|
| Project |
|
| Training |
|
| Others (additional bookings from IFS Human Resources) |
|
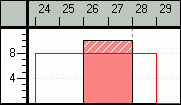
If the resource is planned or allocated outside the normal schedule, the load will be
presented as a bar with diagonal lines, e.g.,![]() .
Figure 3 illustrates an example where the planning has fallen outside the normal
schedule. Two instances can be identified here:
.
Figure 3 illustrates an example where the planning has fallen outside the normal
schedule. Two instances can be identified here:
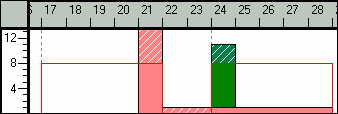
Figure 3: Irregular Planning
In such a case, it is up to the scheduler to take the necessary steps to correct them.
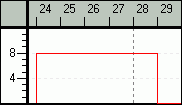
There can also be a third instance: The resource is originally planned/allocated outside the schedule as shown in the example below. The load will still be shown as usual, i.e., Normal Working Hours + Excess Hours. It will appear as if the work is planned to be carried out during the normal schedule, this is because at the time the work load is presented, the free time slots are filled in first.
Consider the following example. An employee has been allocated to work 10 hours from 26-April 6.00 PM to 27-April 7.00 AM. Assumption: Normal Working Hours 8.00 AM - 5.00 PM and does not have any prior allocations. The load will be displayed as shown below:
| Planned Start | Planned Finish | Planned/ Allocated Hours | Resource Load - Before Allocation | Resource Load - After Allocation |
| 26-April 6.00 PM | 27-April 5.00 AM | 10 |
 |
 |