Designing an Advanced Report—Exercises
| IMPORTANT |
| The exercise scenarios in this document uses data from the RACE version
of the database released with App75 SP4 as example data. |
Creating a Chart using Microsoft Excel 2007
Purpose: The purpose of this exercise is to create a chart
for the report that was created in Design exercise.
Windows:
IFS Business Analytics/Go to Design
- Open the report DESIGNXX and click Go To Design
- Select cell C15 and select Insert menu from Microsoft Excel tool bar
and click Column and select 2D -Column.
- Right click in the chart area and click Select Data. Select cell
C13(=Sheet1$C$13) to chart data range.
- Click Ok.
- Right click and select Select Data. In the Horizontal Axis Labels click Edit.
- Enter C4(=Sheet1$C$4) in Axis Label Range
- Click Layout tab and Chart Title from Microsoft Excel tool bar and
enter "Net Profit per Period" as the title above the chart.
- Select layout and click Legend from Microsoft Excel toolbar. Select
None.
- Select Layout and click Data Labels from Microsoft Excel toolbar.
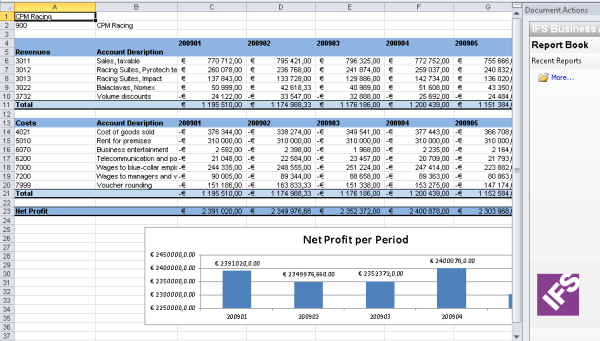
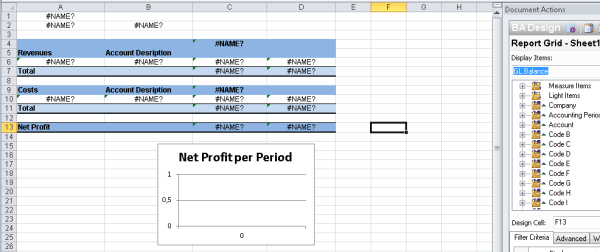
Select Center. Refer to the figure below:
- Click Execute. The executed report should look like the figure
below: