| IMPORTANT |
| The exercise scenarios in this document uses data from the RACE version of the database released with App75 SP4 as example data. |
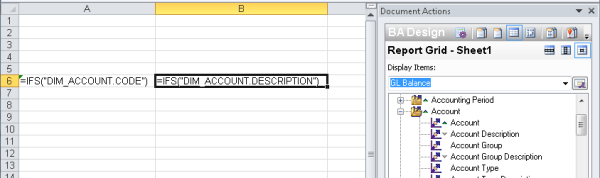
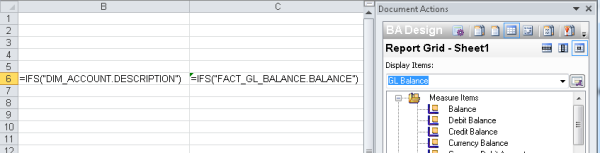
Purpose: The purpose of this exercise is to show you how to create a report using a single Microsoft Excel row.
Scenario: In this exercise, General Ledger Balance will be used as the information source, and the information displayed will be Balance Amount, Account and Account Description. There are no IFS Business Analytics design elements used for this exercise.
Windows:
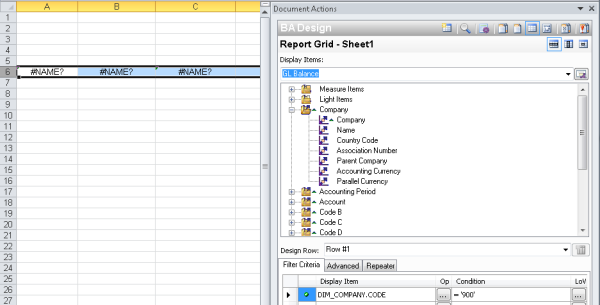
IFS Business Analytics/Go to Design/Row
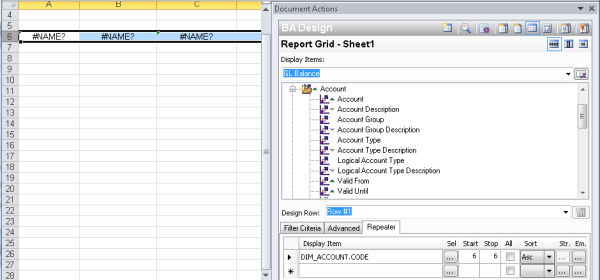
Purpose: The purpose of this exercise is to show you how to add a repeater to a Microsoft Excel row and a filter criteria to the report sheet.
Scenario: In this exercise General Ledger Balances for company 900 will be filtered and displayed as information. The information will be based on Account, Account Description and Amount.
Windows:
IFS Business Analytics/Go to Design
Click Sheet or select the Microsoft Excel sheet to add a filter to display information only for company 900.
Select the Filter Criteria tab and drag Company to the Display Item field for the filter criteria.
Select the operator for the filter criteria row by clicking Op from the Select Operator dialog box select where " = equals" operator.
Select company '900' from the
List of Values dialog box.
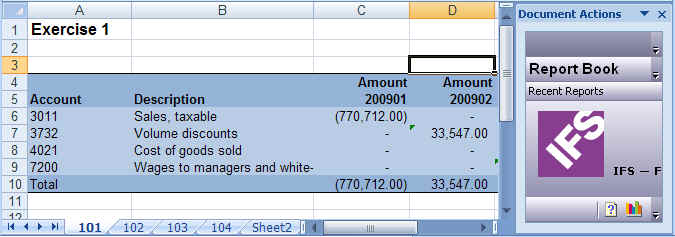
Click Execute. The report will have a row for each
account displaying Account, Account Description and Amount.

If you need to make changes to the
design for e.g. to adjust the column width for column B, go back to Design
Mode and apply the changes.
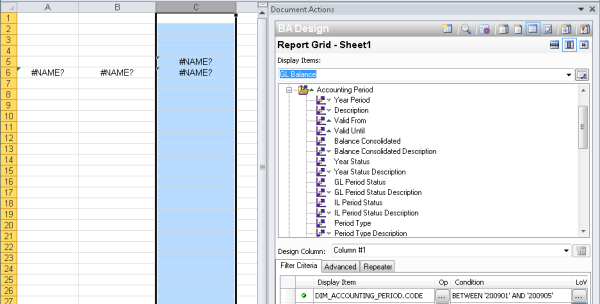
Purpose: The purpose of this exercise is to add a design column to your report.
Scenario: In this exercise, General Ledger Balances for company 900 for year/periods between 2009-01 and 2009-05 will be filtered and displayed as information.
Windows:
IFS Business Analytics/Go to Design/Column
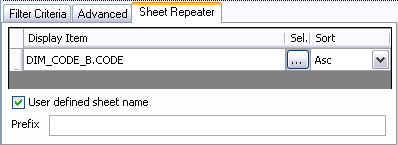
Purpose: The purpose of this exercise is to add a sheet repeater to your report.
Scenario: In this exercise, the report is rearranged to display balance information for each cost centre of company 900 in a separate sheet..
Windows:
IFS Business Analytics/Go to Design/Sheet
Purpose: The purpose of this exercise is to show you how to add basic Microsoft Excel features to IFS Business Analytics report.
Windows:
IFS Business Analytics/Go to Design
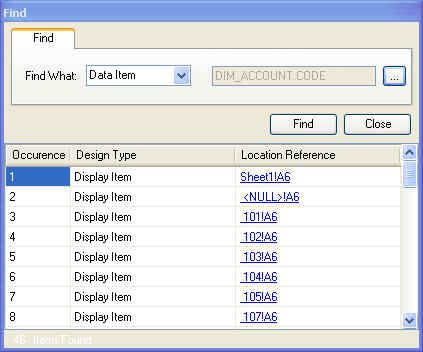
Purpose: The purpose of this exercise is to show you how to find a data item or a parameter used in a Business Analytics report design using the Find feature.
Window:
IFS Business Analytics/Go to Design
Select Account under Account in the List of Values as the display item to find.
Click Find. All the occurrences of the Account display item will be listed in the table in Find dialog box.